Let's Talk Weather
Weather talk and San Diego don’t often go in the same sentence, thanks to the region’s reputation for its near constant sunny disposition. Yet, it has its share of severe weather events from wildfires to flash floods.
Recently, I came across the NOAA (National Oceanic and Atmospheric Administration) website and browsed through some of its datasets. The NOAA oversees the monitoring of a wide range of weather conditions covering the oceans and the atmosphere and is responsible for recording (and making available) the environmental data it collects as part of its mission.
Accessing the websites of one of its satellite agencies, like the NWS (National Weather Service), directly can be a bit overwhelming - like walking into the Amazonian wilderness without a map. Thankfully, the NOAA site itself is designed with user experience in mind, making it quite easy to get to the data we need. I was looking to get a sense of the weather events impacting the San Diego county and was able to find my way after about an hour or so of poking around the site.
I went about analyzing data in the Storm Event Database for the last 20 years from 1997-2016. The database is named misleadingly enough that its easy to assume that it only contains data on storms. Rather, what one finds is that it contains data on any > “significant weather phenomena having sufficient intensity to cause loss of life, injuries, significant property damage, and/or disruption to commerce”.
Here’s what I learnt from the analysis.
- Wildfires are the most impactful event both in terms of their social and economic impact. They are also disproportionately higher in impact compared to every other severe weather event experienced by the region accounting for ~90% of all damage to property, ~50% of all injuries, ~30% of all deaths and damage to crops over the last 20 years spanning 1997-2016.
- Only 5 events (in the last 20 years) accounted for over 70% of all deaths and injuries and over 90% of all damage to property.
Below you’ll find the top-ten events by social and economic impact.


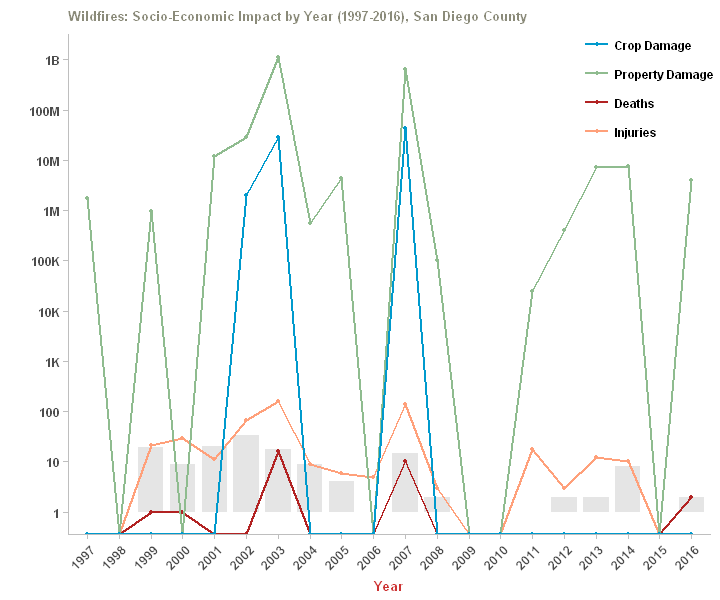
- High impact events like the wildfires are capable of causing widespread death and destruction even with a few incidents. Years 2003 and 2007 highlight this quite clearly. In both cases, wildfires accounted for over 70% of all deaths, over 90% of all property damage, between 60-97% of injuries and 25-50% of crop damage even as they accounted for less than 25% of all severe weather events experienced by the region.
In this plot below the lengths of the gray bars represent the number of wildfire incidents in the year.

Additional Analysis
For additional analysis and the R code used to generate these plots and insights take a look at the R notebook here.
ANALYSIS R VISUALIZATION ggplot FORMAT gzip/csv ACCESS Direct Download