Flu in the Air. Flu on my Mind.
It’s the end of January and that usually means two things for most people: (a) they’ve more or less abandoned their new year resolutions and (b) they are in the middle of a bout of flu or know someone who is.
End of January/beginning of February is the peak of the flu season in this part of the country and having only just recovered from a bout of flu myself I was eager to get my hands on some influenza datasets.
Now, of course, most people remember that Google used to publish flu trends each year based on flu-related search terms and their correlation to the flu season. It’s flaws have been well-documented and Google rightly put an end to the program in 2015. Nevertheless, big data enthusiasts continue to salivate at the thought of nowcasting and there is yet hope that GFT will once again be a part of our lives sometime in the future.
But until such a time, the CDC and local health service agencies are still our best bet for flu datasets of a certain accuracy. For the San Diego (SD) county this data can be downloaded from the open data portal of the SD HHSA (Health and Human Services Agency) know as Livewell SD.
The flu dataset that I was able to download had only 5 years worth of data spanning 2011-2015. The data provided population counts of those afflicted by the flu apart from rates (per population of 100K) for various geographies covering the San Diego county. Flu outcomes recorded in the data covered fatalities, hospitalizations and ED (Emergency Dept) discharges.
Below are some insights from my analysis of the flu data for the county.
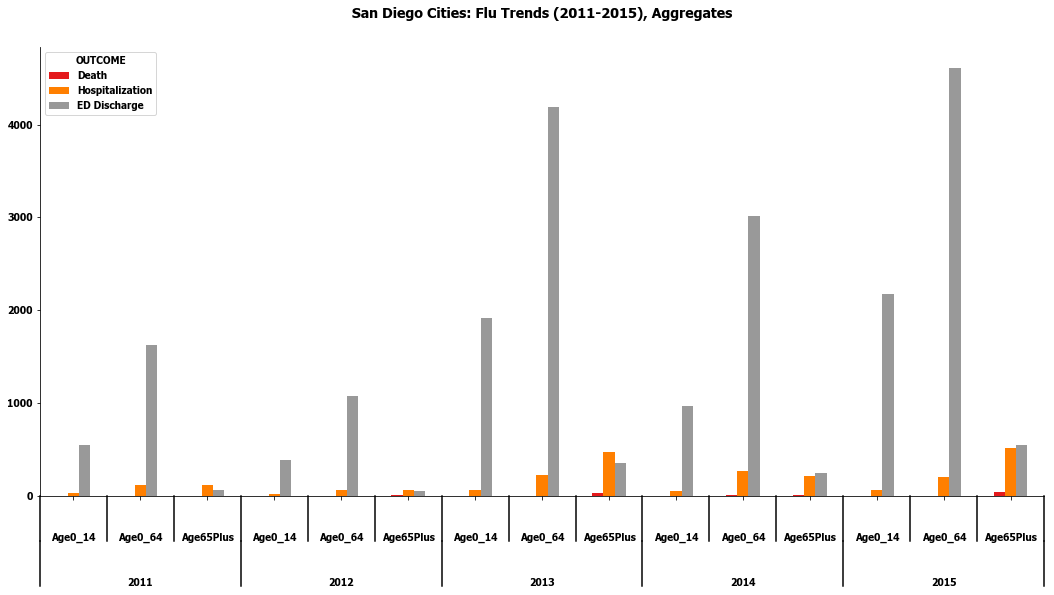
- In any given year, the number of ED discharges outnumber the hospitalizations and both vastly outnumber the fatalities. This is true across all age groups except seniors (65 years and older) and across all municipalities (i.e.: cities) represented in the dataset. Among seniors, the number of hospitalizations are likely to be closer to ED discharges, often overtaking them.
- Seniors are the dominant group affected by fatalities from flu with outcomes among non-seniors being dominated by ED discharges.

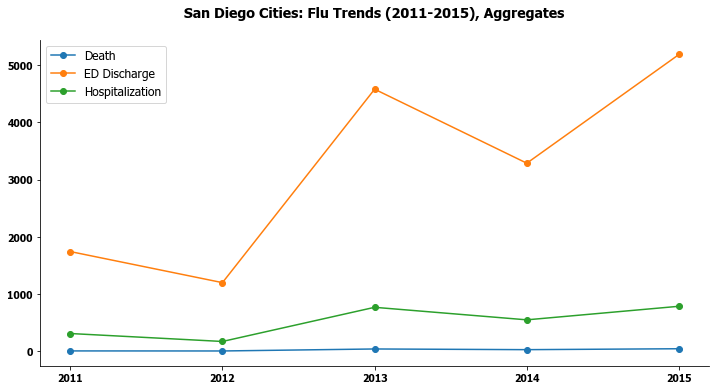
- In the last 5 years spanning 2011-2015, 2013 and 2015 had larger outbreaks of flu than the other years. This was characterized by significantly higher rates of flu among all age-groups. Note: Such differences can also be the result of more robust data reporting and gathering in those years.

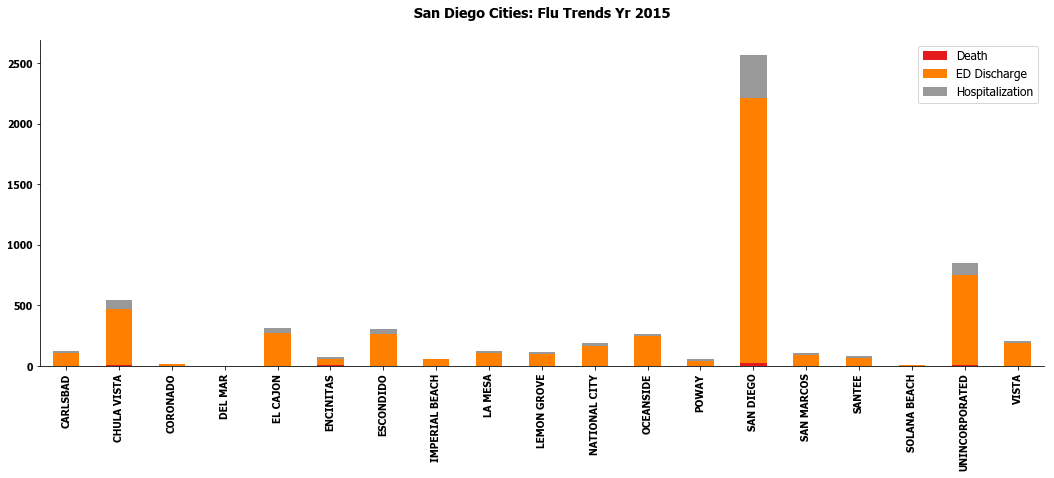
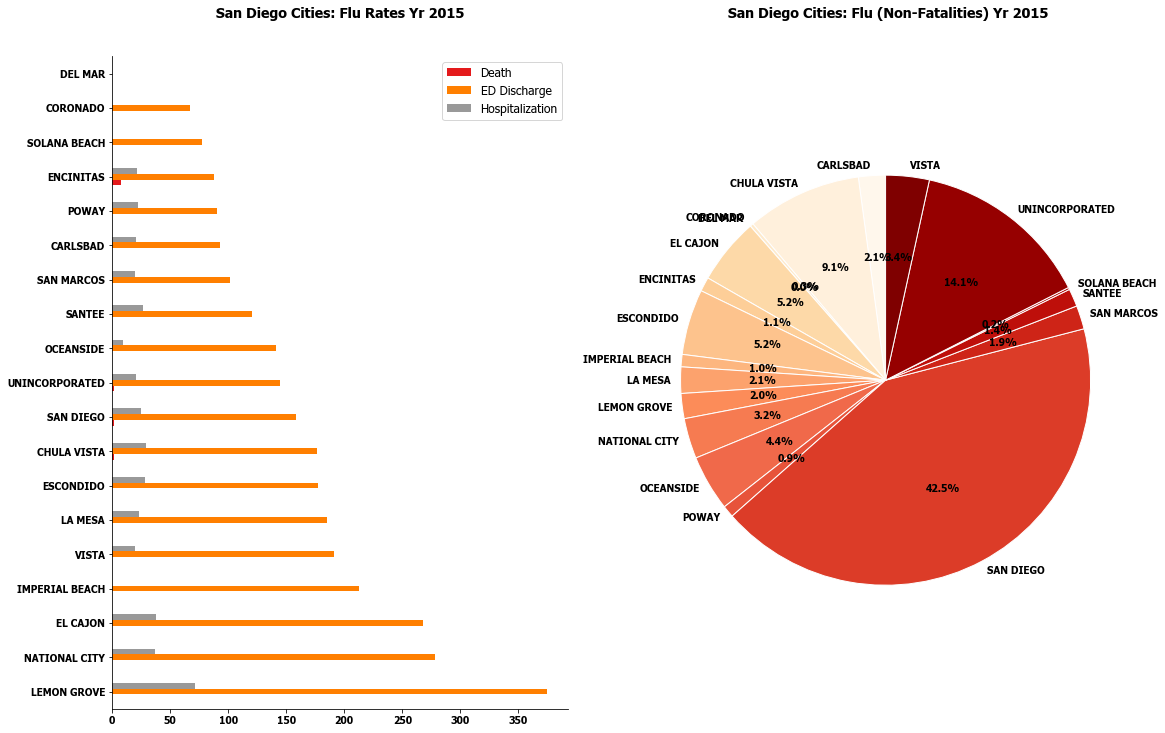
- In 2015, the City of San Diego and the Unincorporated Areas accounted for a significantly larger share of all flu incidences (non-fatal) with approximately 42% and 14% of the total across all municipalities. This was a result of these regions having a greater total population, rather than a bigger outbreak of the flu, as revealed by inspecting the flu rates for the same time period. This is a pattern repeated each year.

- In 2015, 8 cities in the county had higher rates of flu (non-fatal incidences) than the City of San Diego, with Lemon Grove having the highest rate. Flu rates are, in effect, the true indicator of a community’s vulnerability to flu. This is more so since the cities that make up the SD county vary widely both in total population as well as in population density.

Additional Analysis
For additional analysis and the Python code used to generate these plots and insights take a look at the Python notebook here.
ANALYSIS Python VISUALIZATION matplotlib FORMAT csv ACCESS Direct Download