Homeless in San Diego
A couple of weeks ago I volunteered as a counter on the annual point-in-time (PIT) count of the homeless organized by the Regional Task Force for the Homeless. I was fortunate enough to team-up with a couple of experienced volunteers from the area we were surveying. For 3 hours, starting at 4AM, we drove through every nook and corner of a fairly large tract of land - covering my neighborhood and the one adjacent to it - scouring for makeshift tents, vehicles in isolated spots among other telltale signs of the homeless. It was a singular experience, to be part of something this consequential, and of this magnitude (1500+ volunteers covering the entire county).
RTFH-SD has been releasing data collected as part of the PIT count in San Diego for the last couple of years now. These PIT counts are part of a nation-wide effort to measure homelessness and is mandated by the Federal government. The Federal government, or more precisely, the Housing and Urban Development agency a.k.a HUD is also the best place to find historical data (county and state-wide) on the homeless.I took some time out to analyze this data to see what I might discover about the homeless in San Diego.
Before I go any further though, I have to acknowledge that PIT counts are not considered the most accurate. The choice of a night in mid-to-late January (to carry out the PIT count) is not a coincidence. It is assumed that, given the peak winter conditions, most homeless are likely to be found in shelters - where it is easier to count them, as well as prevent double counting - thus increasing the accuracy of the count. The pre-dawn hour for the count is also chosen for the same purpose, since the unsheltered homeless are expected to be stationary at that time of the day. But San Diego being a city of warmer climate these assumptions need not hold true. This among other problem areas is the reason behind inaccuracies in the PIT count. That said, the PIT count is still the official measure of homelessness across the US.
For this analysis I used 10 years worth of homeless data (pretty much all of what HUD had available) on the county spanning 2007-2016. I also collected this data for two other counties - Dallas County, TX and Orange County, CA with the intention of comparing homelessness trends. These counties were chosen for their likeness to San Diego across several key socio-economic indicators. Comparisons across peer counties and cities are one way to gain insights into what works and what doesn’t policy-wise and are much sought after. In fact, I came across a tool for peer city identification that I think I will be using a fair bit in the future. For the purpose of this analysis however, I used the IndexMundi site to compare county stats.
Here’s what I gathered from the analysis:
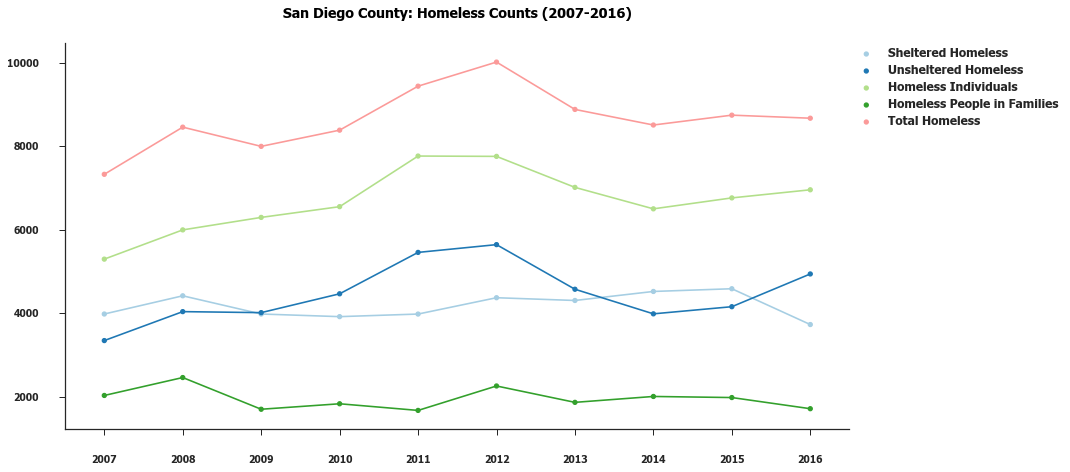
- San Diego’s homeless counts are trending upwards for the decade spanning 2007-2016. A statistical analysis of these trend lines indicate that they are not linear, which is to say that there are ebbs and flows (something that’s easily seen from the plot) and the story behind is more complex than the narratives that one often hears.

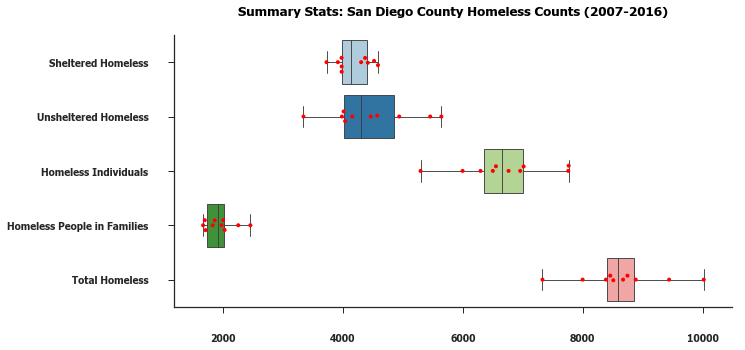
- A majority of the homeless remain unsheltered, and individuals (i.e.: those outside of families) are the most vulnerable group, prone to homelessness by significantly larger numbers than those with families. This was a trend that was observable not just in San Diego but also in the two other counties analyzed.

In the above plot, the larger spread for homeless individuals is what points to their higher vulnerability.

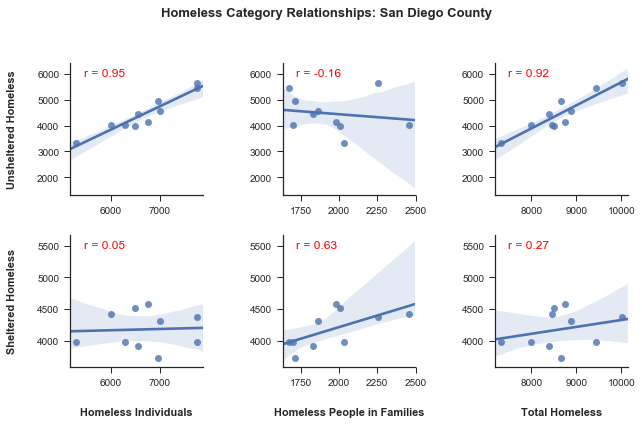
Looking at relationships between these homeless categories we can similarly see the high degree of correlation between homeless individuals and the unsheltered homeless, as well with the total homeless population and those that are unsheltered.
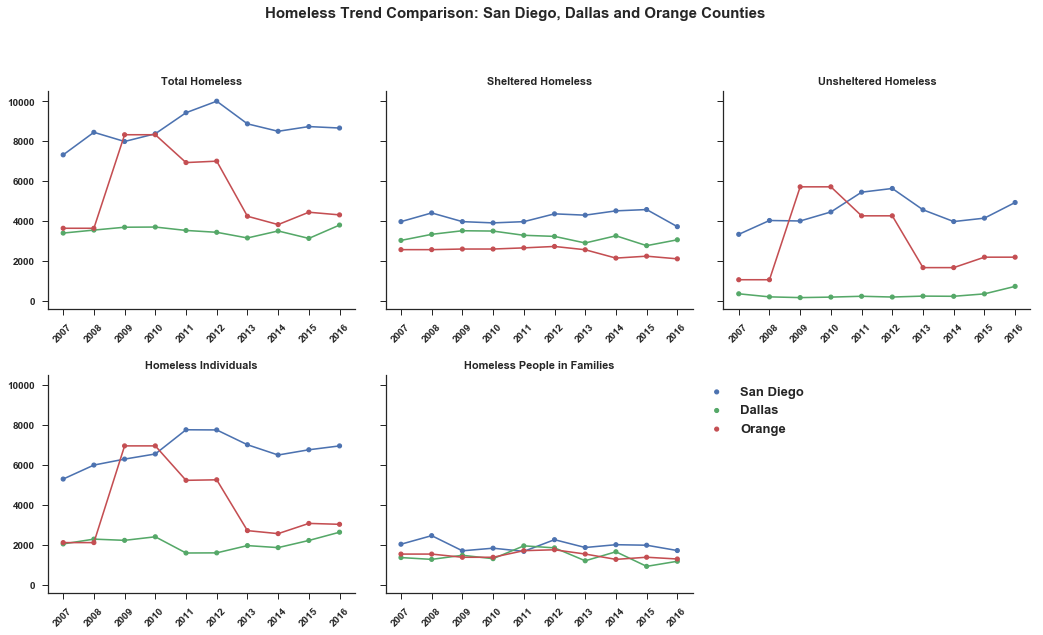
- San Diego has greater numbers of homeless on average, across all categories, compared to Dallas and Orange counties. The difference in homeless counts between San Diego and Orange counties is especially striking given the regions’ significant similarities. This potentially points to differences in policy that may be worth examining further.


A comprehensive look at the homeless situation in the US for the years 2007-2016 can be found through these HUD reports:
Additional Analysis
For additional analysis and the Python code used to generate these plots and insights take a look at the Python notebook here.
ANALYSIS Python VISUALIZATION seaborn FORMAT xlsx (Excel) ACCESS Direct Download